Community
Basic Concept of Performance Test
- AuthorAdministrator
- Date2024.01.05
Basic Concept of Performance Test
Performance test of business systems is essential to ensure stable performance when implementing new systems or ensuring performance of currently operating system.
Commercial performance testing tools are often used, but open-source performance measurement tools are also used for their easier and faster access. This article describes the performance testing methods and tool usage done in ITSM implementation project.
What is performance test?
Performance test assesses the efficiency of software. Typically, it involves assessing execution time, response time, processing power, and resource usage under expected loads.
From a user perspective, performance testing can also be considered as a method of verifying and validating system components whether they are performing normally under specific conditions.
Why conduct performance test?
First, for example, we often encounter situations we personally or know around us, such as concerts, flights, and course registration, where servers often crash due to a sudden surge of users accessing the same time slot.
To minimize these issues, we proactively check for and address performance issues that may arise during service provision, remove bottlenecks, and ensure system reliability and stability.
Performance test types
There are several types of tests, but the following three are representative test cases.
1) Load Test: Measures system processing performance for transactions generated by a high number of concurrent users or requests.
2) Stress Test: Measures maximum system performance by exceeding a threshold number of requests.
3) Scalability Test: Measures continuity by monitoring changes in memory/performance information over an extended period of time.
Performance testing tool
There are various tools available, including Perfmon from Windows and HP's LoadRunner. Among them, Apache Jmeter, an open-source tool, is widely used for its easiness. Therefore, I will explain how to measure and configure Jmeter.
Performance Measurement
Before measuring, you must first understand the concept of TPS.
TPS: Transactions per second is a metric that serves as a benchmark for service performance (number of completed transactions / measurement time).
A higher TPS means better performance, but it is important to adjust TPS according to the system's purpose.
With the target of 50 TPS, I will explain about Load test.
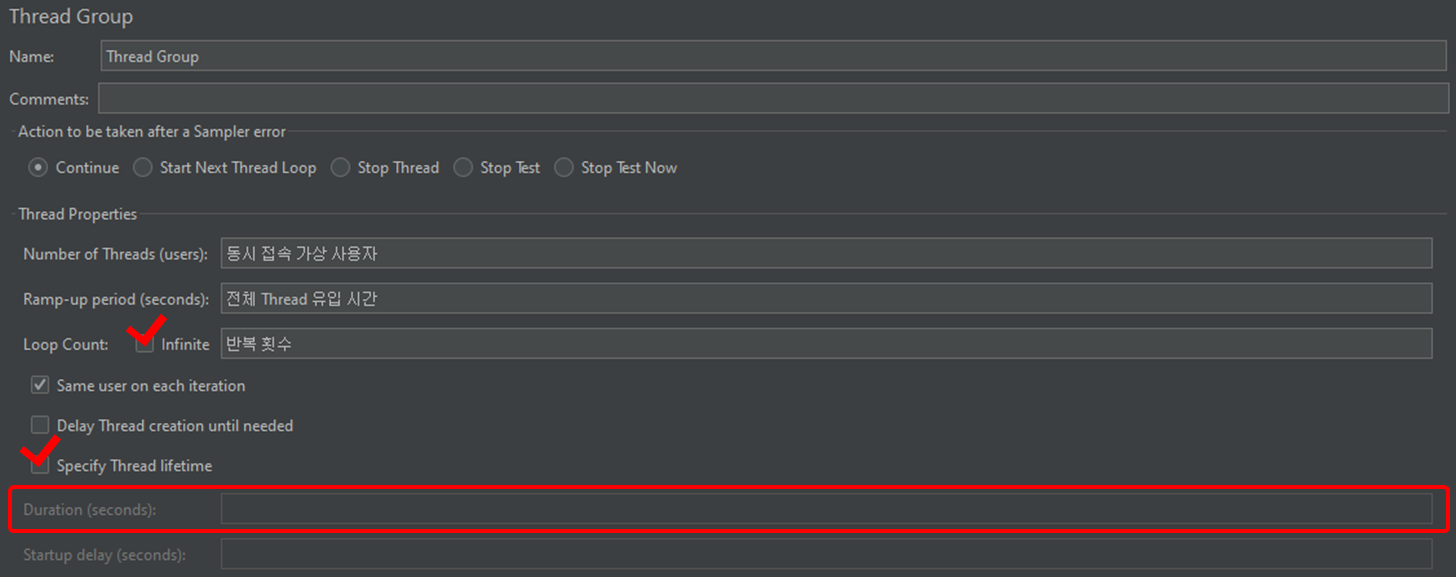
When configuring Jmeter, configure Thread Count (virtual users accessing the same server), Ramp-up (total thread inflow time), and Loop Count (the number of iterations).
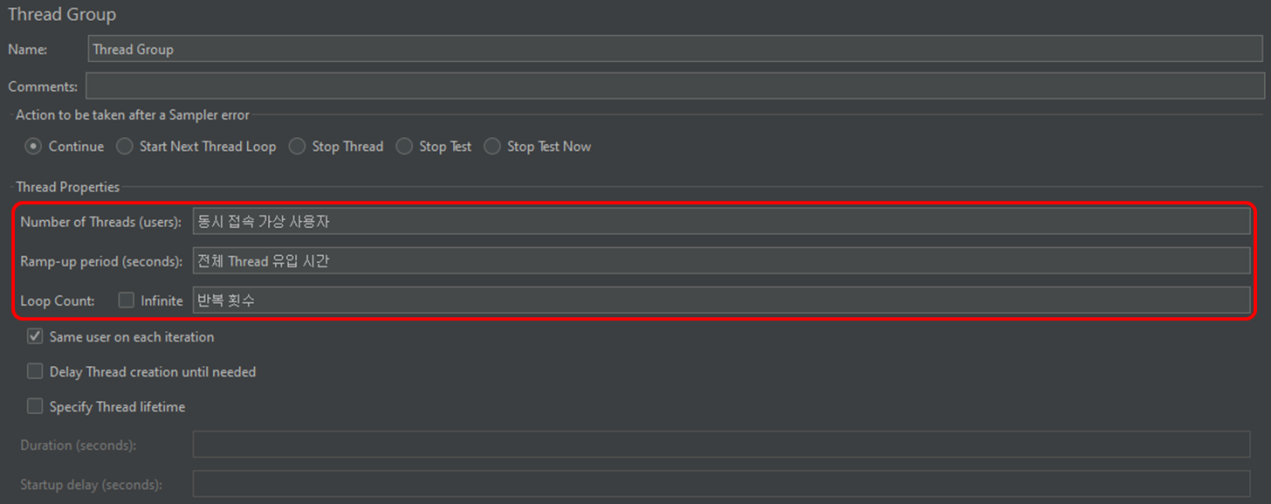
[Figure 1] Basic Configuration
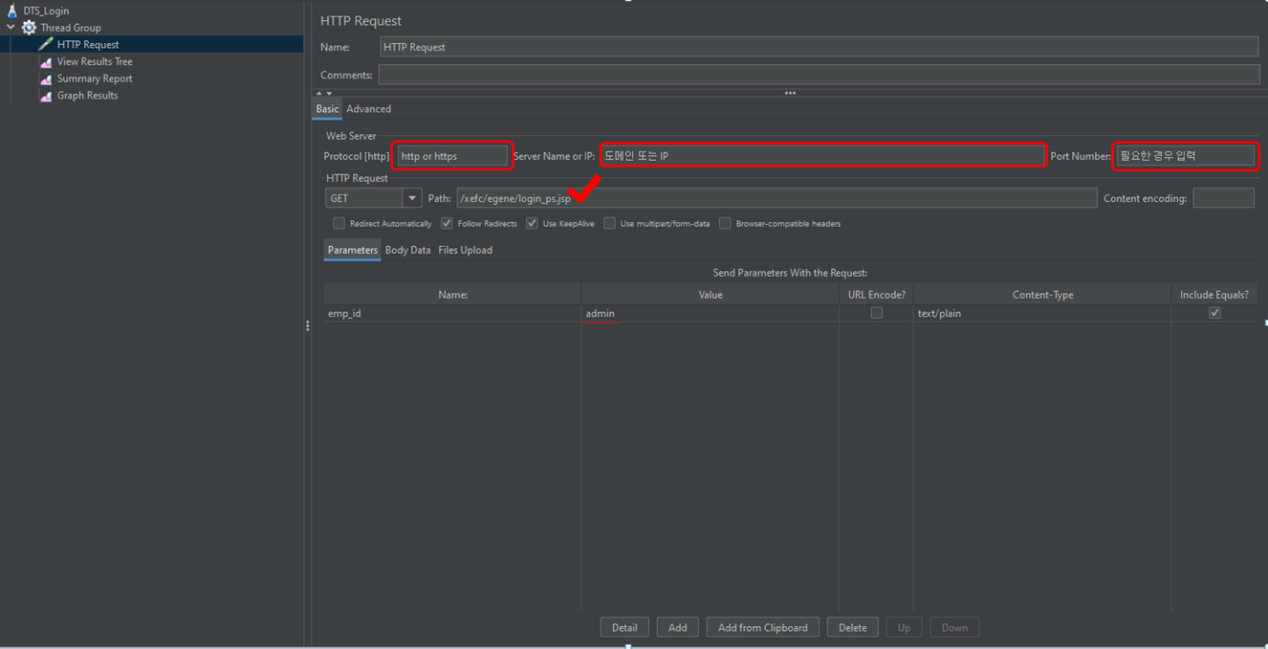
[Figure 2] Request Page Settings (1/2)
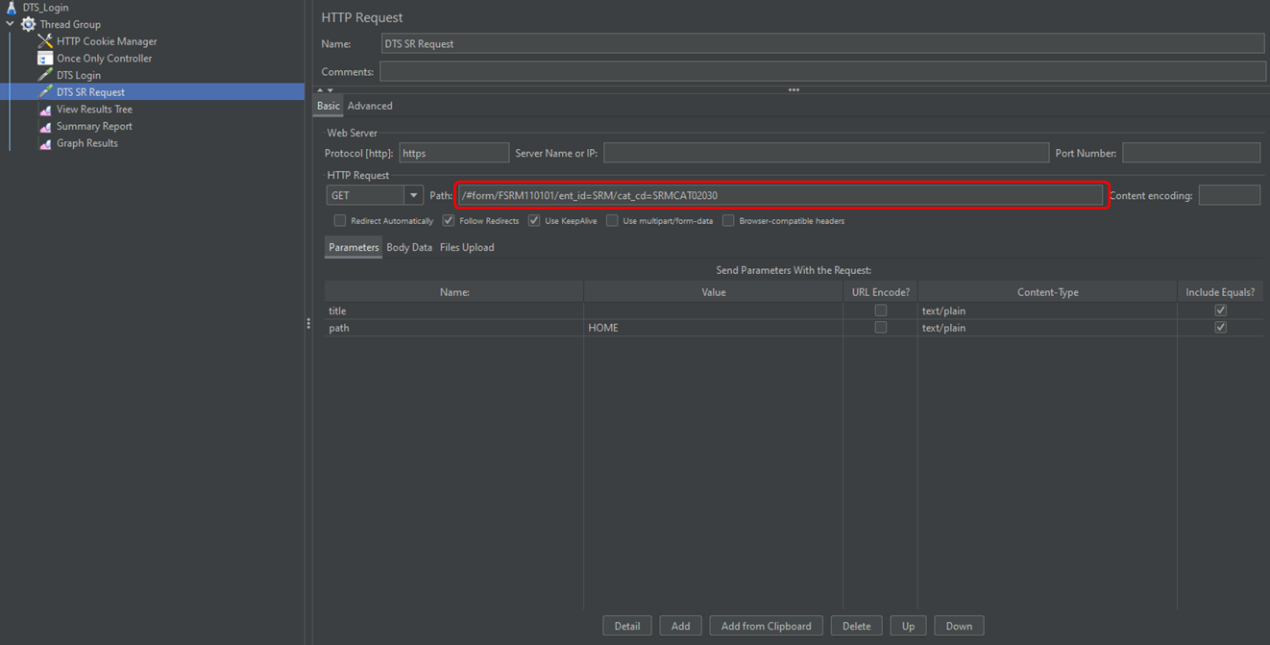
[Figure 3] Request Page Settings (2/2)
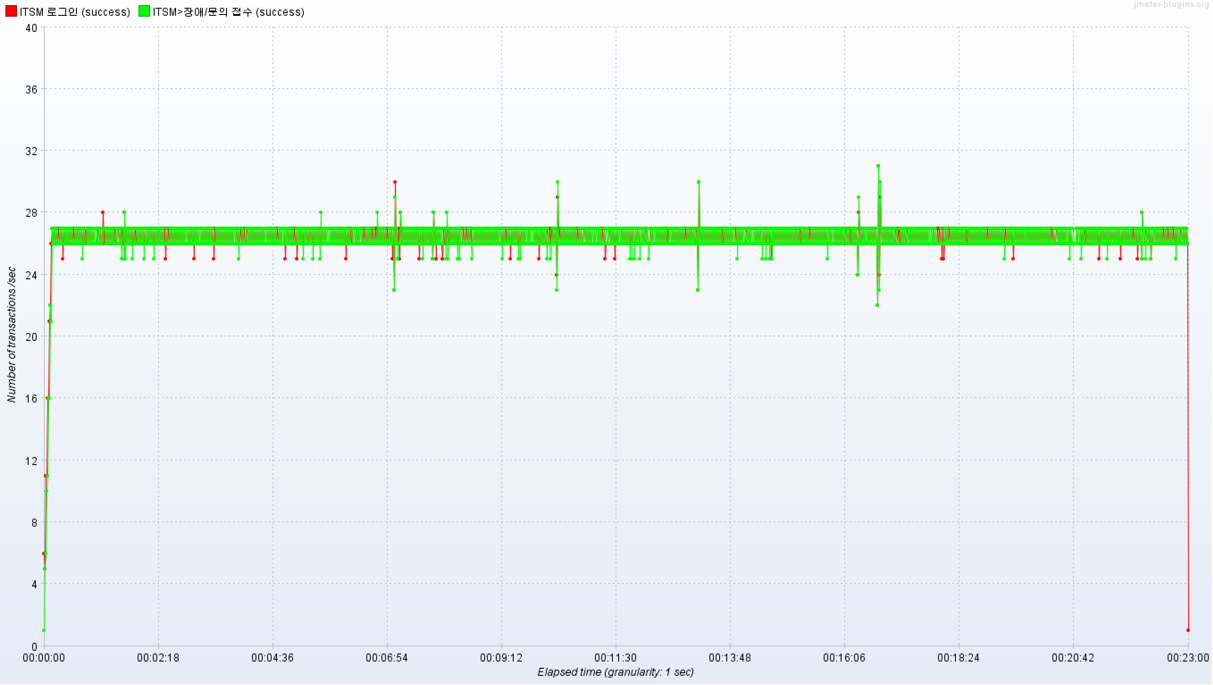
[Figure 4] TPS Results (Graph)
[Figure 5] Performance Test Summary Report

[Figure 6] Additional Settings
Conclusion
Most performance tests conducted on projects are only completed internally. I've conducted several performance tests myself, and they often require more work than expected. To address this issue, I have developed a standard performance testing module for our solution to provide some assistance when conducting performance tests within projects. Next, I plan to focus on areas that can be helpful internally and externally.Kang Seok-hwan, PSP Team, STEG Inc.